Smart Mapping Lesson: Clustering
- Weixiao Hu
- Sep 25, 2021
- 1 min read

This time, I learn how make a smart map, that use mapping to show the recorded date of a selected item.
The first step, I read the "Enhanced Clustering in the new Map Viewer" article to learn and understand the step and tool to map a cluster.
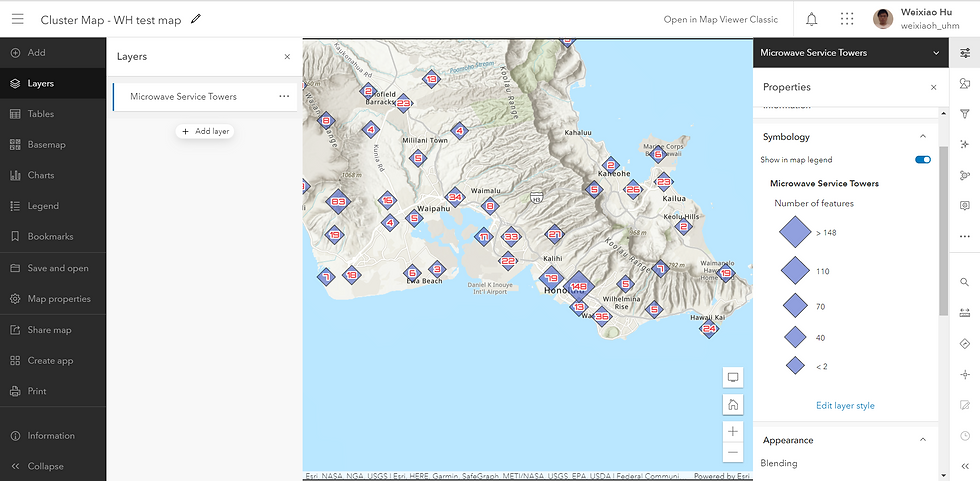
To start the a cluster map, I added the "Microwave Service Towers" layers and data to the map viewer, and use the build in clustering tool to enable clustering and show cluster data of microwave service towers.

Then, I try to customize cluster labels changing the color and font of text and added outline for the text to make the cluster value number more knowable.

Next, I customize cluster pop-up and reword the summary to show and tell number and data value with in the cluster.

Lastly, I edit the cluster symbol to show smoother color tone.
Comments